Build Analysis
Analyzing build statistics is a good step towards understanding webpack better. Visualizing webpack output helps you to understand the composition of your bundles.
Configuring Webpack
To get suitable output, you need to do a couple of tweaks to the configuration. At a minimum, you should set the --json flag and pipe the output to a file as follows:
package.json
"scripts": {
leanpub-start-insert
  "build:stats": "webpack --env production --json > stats.json",
leanpub-end-insert
  ...
},
The above is the basic setup you need, regardless of your webpack configuration. Execute npm run build:stats now. After a while you should find stats.json at your project root. This file can be pushed through a variety of tools to understand better what's going on.
You can also consider using the following flags:
--profileto capture timing-related information. The setting is optional but good to set.--progressto show how long webpack spent in different stages of the build.
To understand why webpack includes a specific module to the build while processing, use whybundled or webpack-why.
--display-reasonsflag gives more information as well. Example:npm run build -- --display-reasons.
W> Given you piggyback on the production target in the current setup; this process cleans the build directory! If you want to avoid that, set up a separate destination where you don't clean.
Node API
Stats can be captured through Node. Since stats can contain errors, so it's a good idea to handle that case separately:
const webpack = require("webpack");
const config = require("./webpack.config.js")("production");

webpack(config, (err, stats) => {
  if (err) {
    return console.error(err);
  }

  if (stats.hasErrors()) {
    return console.error(stats.toString("errors-only"));
  }

  console.log(stats);
});
This technique can be valuable if you want to do further processing on stats although often the other solutions are enough.
If you want JSON output from
stats, usestats.toJson(). To get verbose output, usestats.toJson("verbose"). It follows all stat options webpack supports.
To mimic the
--jsonflag, useconsole.log(JSON.stringify(stats.toJson(), null, 2));. The output is formatted to be readable.
StatsWebpackPlugin and WebpackStatsPlugin
If you want to manage stats through a plugin, check out stats-webpack-plugin. It gives you a bit more control over the output. You can use it to exclude specific dependencies from the output.
webpack-stats-plugin is another option. It allows you to transform the data before outputting it.
Enabling a Performance Budget
Webpack allows you to define a performance budget. The idea is that it gives your build size constraint which it has to follow. The feature is disabled by default and the calculation includes extracted chunks to entry calculation. If a budget isn't met and it has been configured to emit an error, it would terminate the entire build.
To integrate the feature into the project, adjust the configuration:
webpack.config.js
const productionConfig = merge([
leanpub-start-insert
  {
    performance: {
      hints: "warning", // "error" or false are valid too
      maxEntrypointSize: 50000, // in bytes, default 250k
      maxAssetSize: 450000, // in bytes
    },
  },
leanpub-end-insert
  ...
]);
In practice, you want to maintain lower limits. The current ones are enough for this demonstration. If you build now (npm run build), you should see a warning:
WARNING in entrypoint size limit: The following entrypoint(s) combined asset size exceeds the recommended limit (48.8 KiB). This can impact web performance.
Entrypoints:
  main (103 KiB)
      manifest.3fd9a1eb.js
      manifest.d41d8cd9.css
      vendor.0a4df2ff.js
      vendor.3dd53418.css
      main.9043ef51.js
      main.d5d711b1.css
You can increase the limit or remove the configuration to get rid of the warning. An attractive option would be to replace React with a lighter alternative as discussed in the Consuming Packages chapter.
Available Analysis Tools
Even though having a look at the file itself gives you an idea of what's going on, often it's preferable to use a particular tool for that. Consider the following.
The Official Analyse Tool
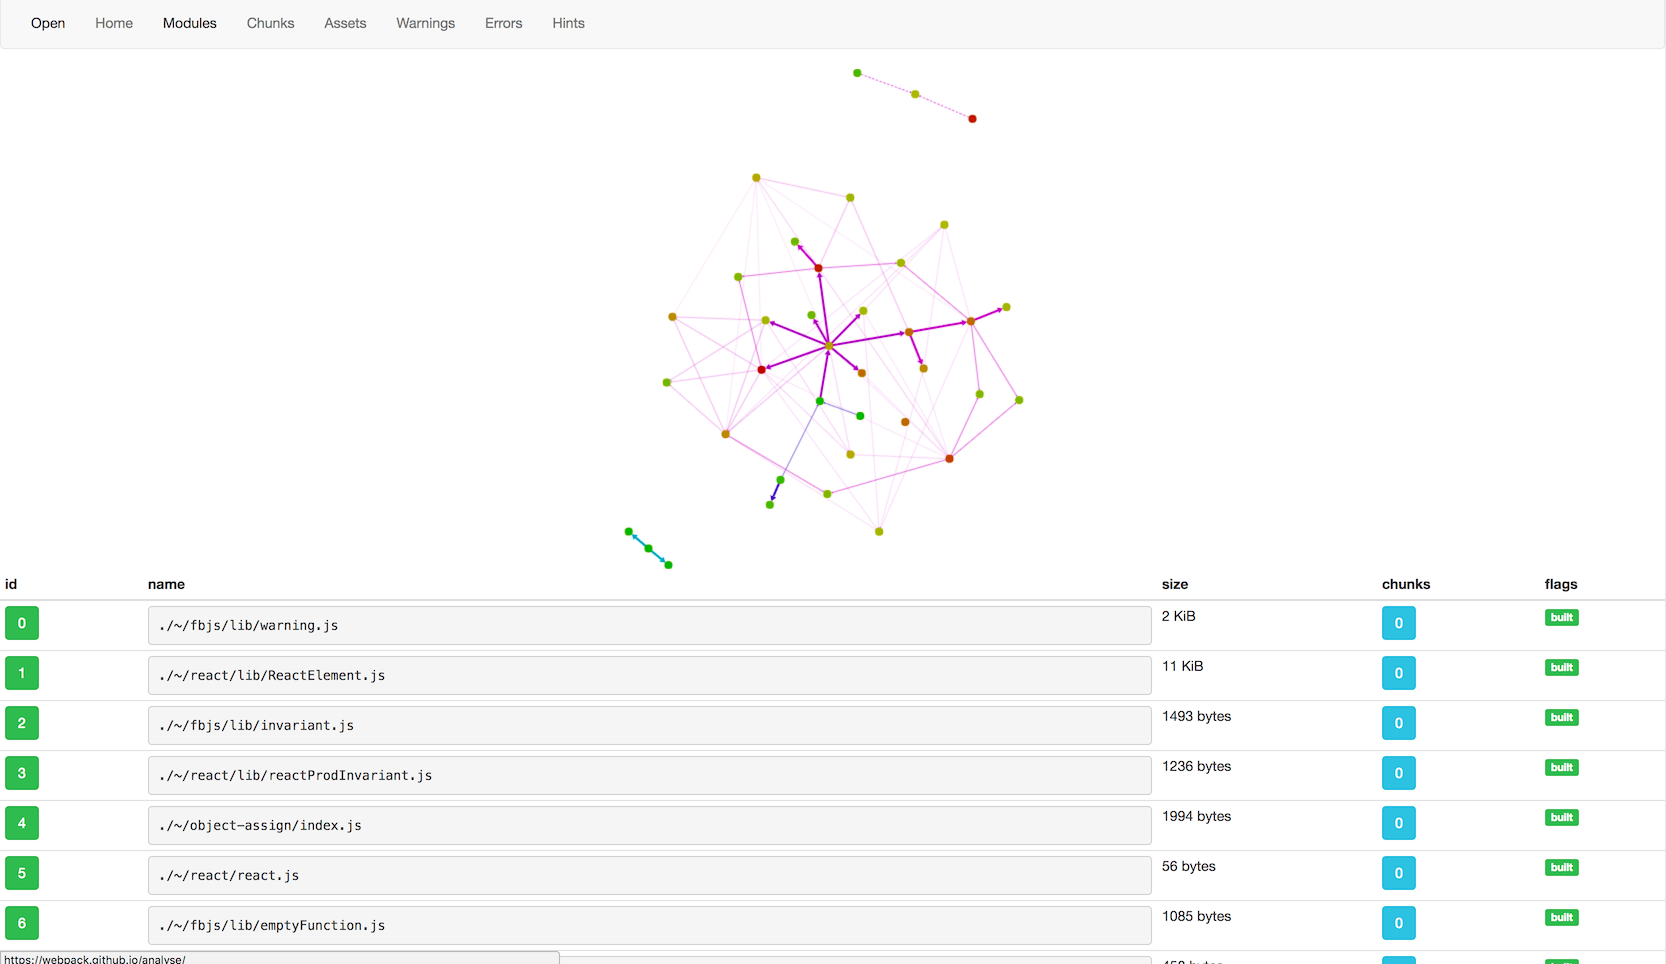
The official analyse tool gives you recommendations and a good idea of your application's dependency graph. It can be run locally as well.
Webpack Visualizer
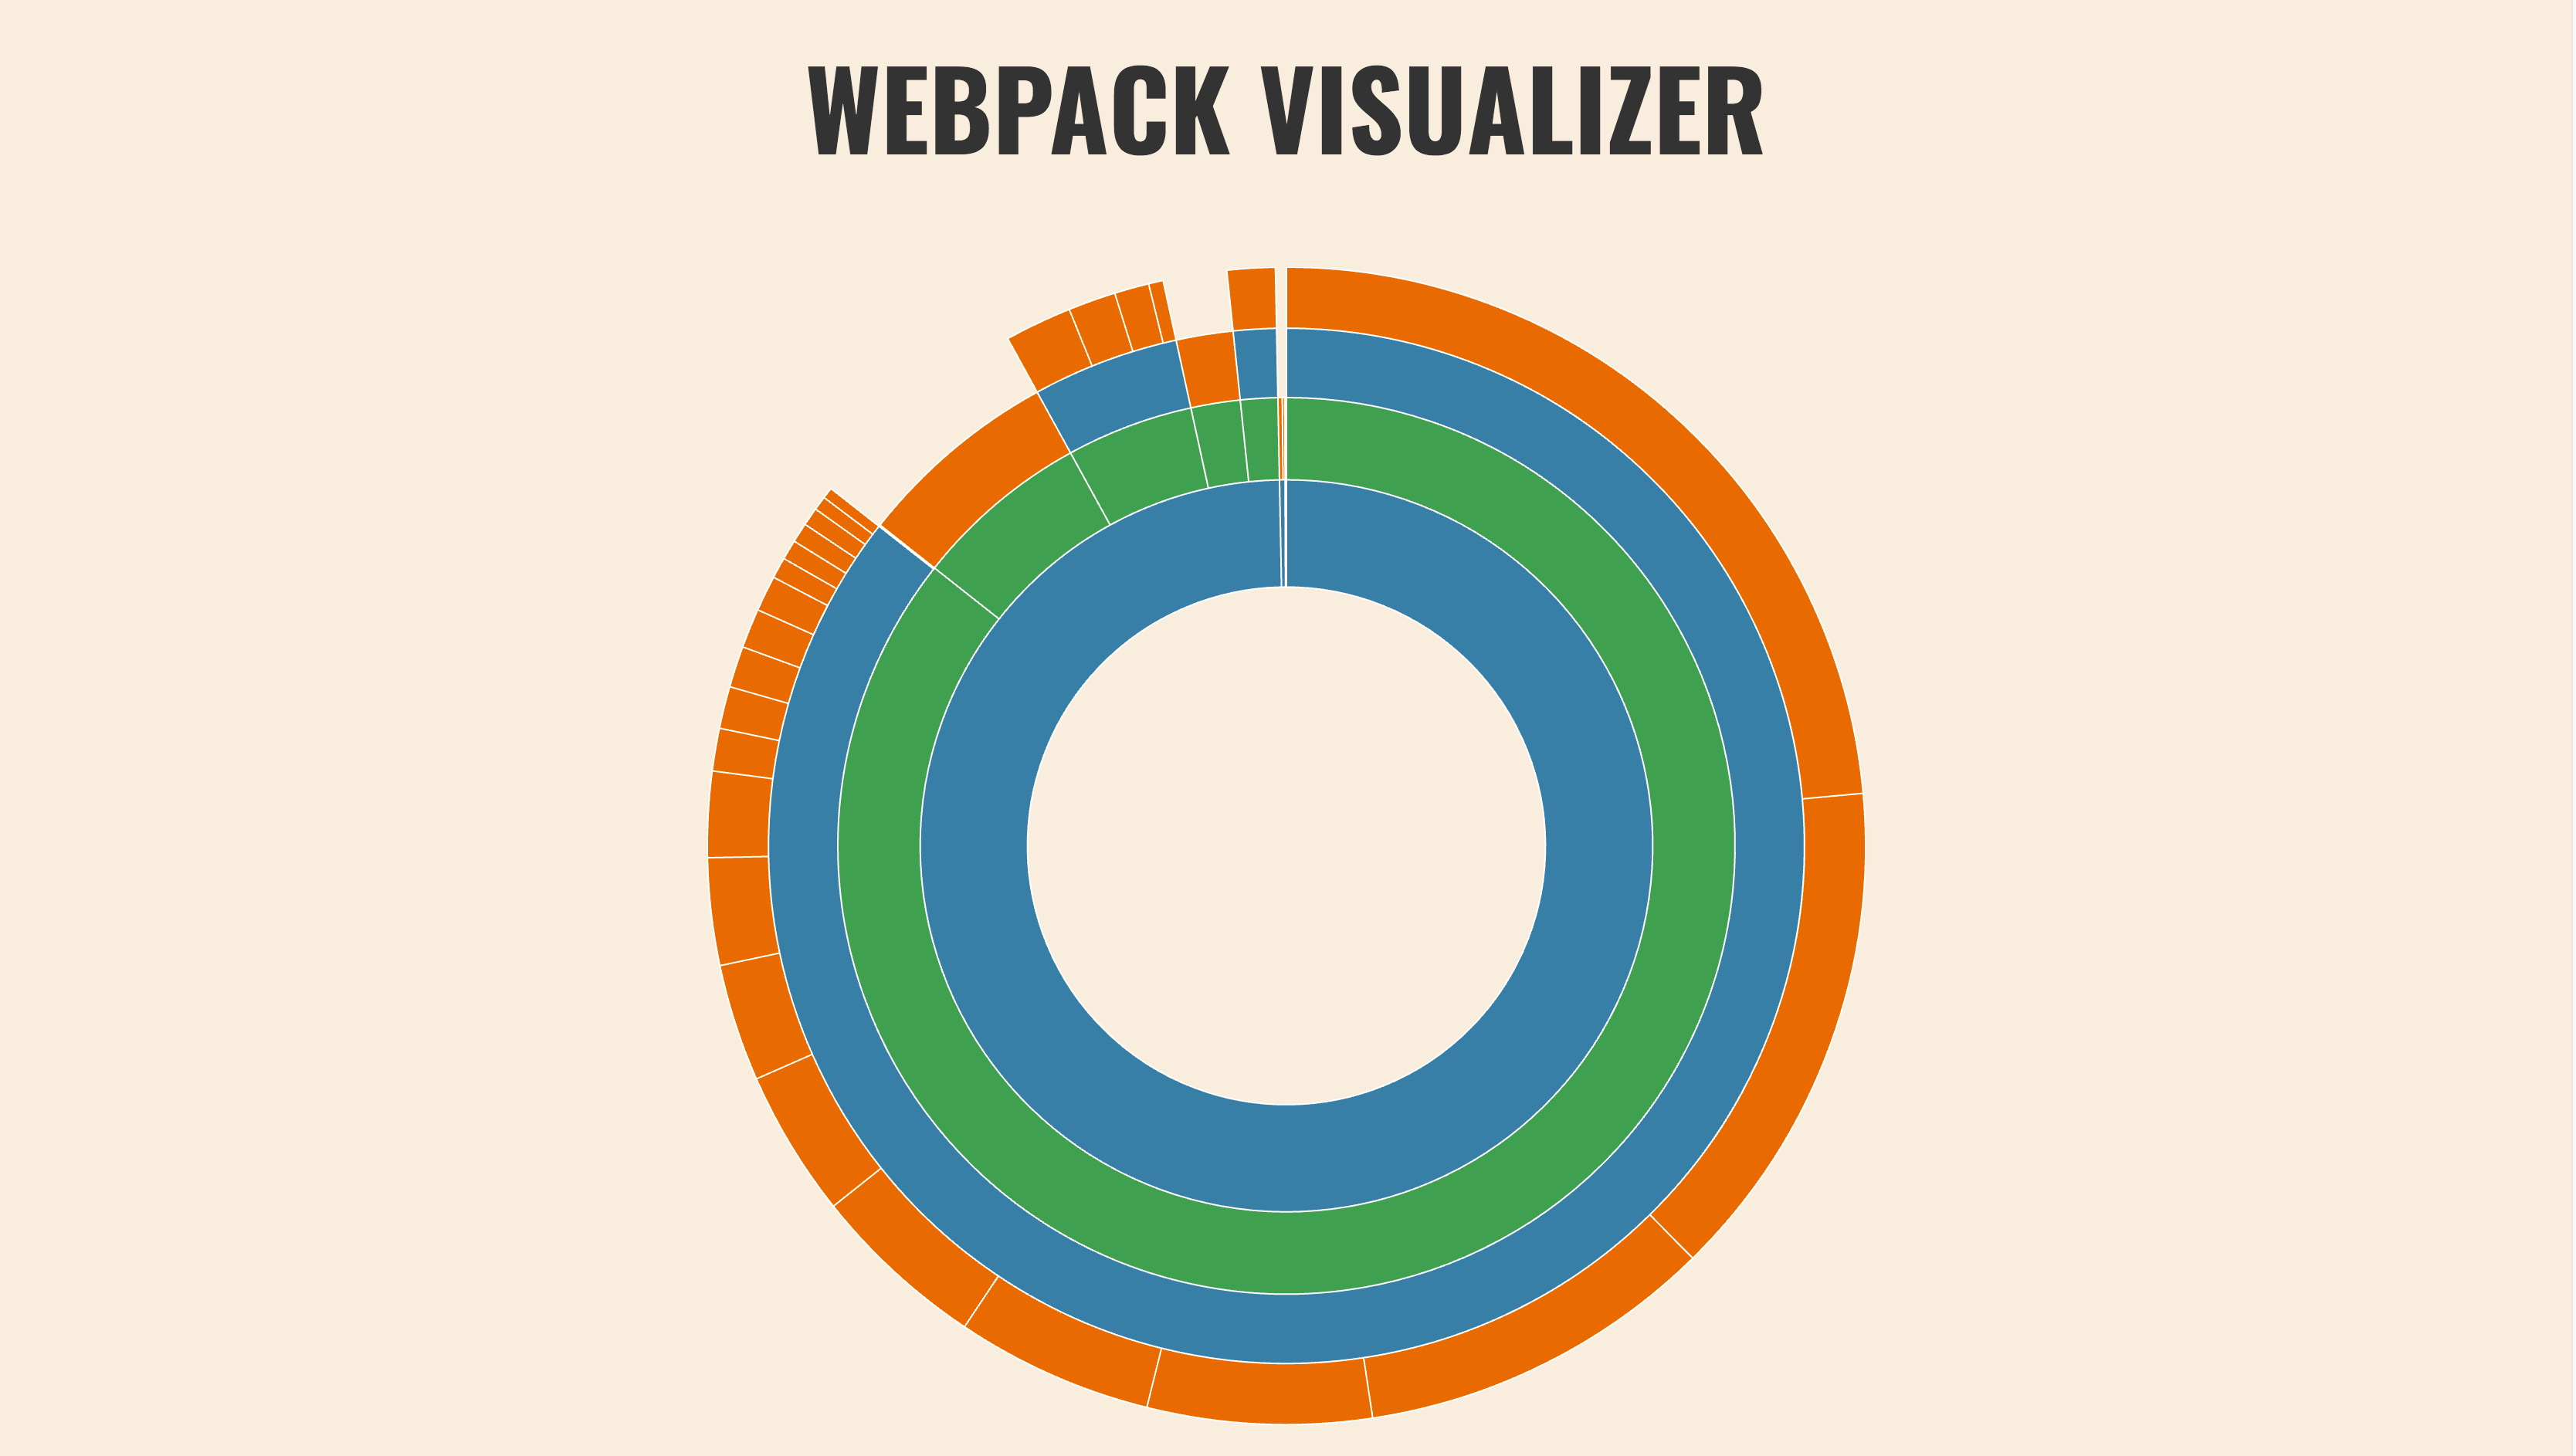
Webpack Visualizer provides a pie chart showing your bundle composition allowing to understand which dependencies contribute to the size of the overall result.
DuplicatePackageCheckerPlugin
duplicate-package-checker-webpack-plugin warns you if it finds single package multiple times in your build. This situation can be hard to spot otherwise.
Webpack Chart
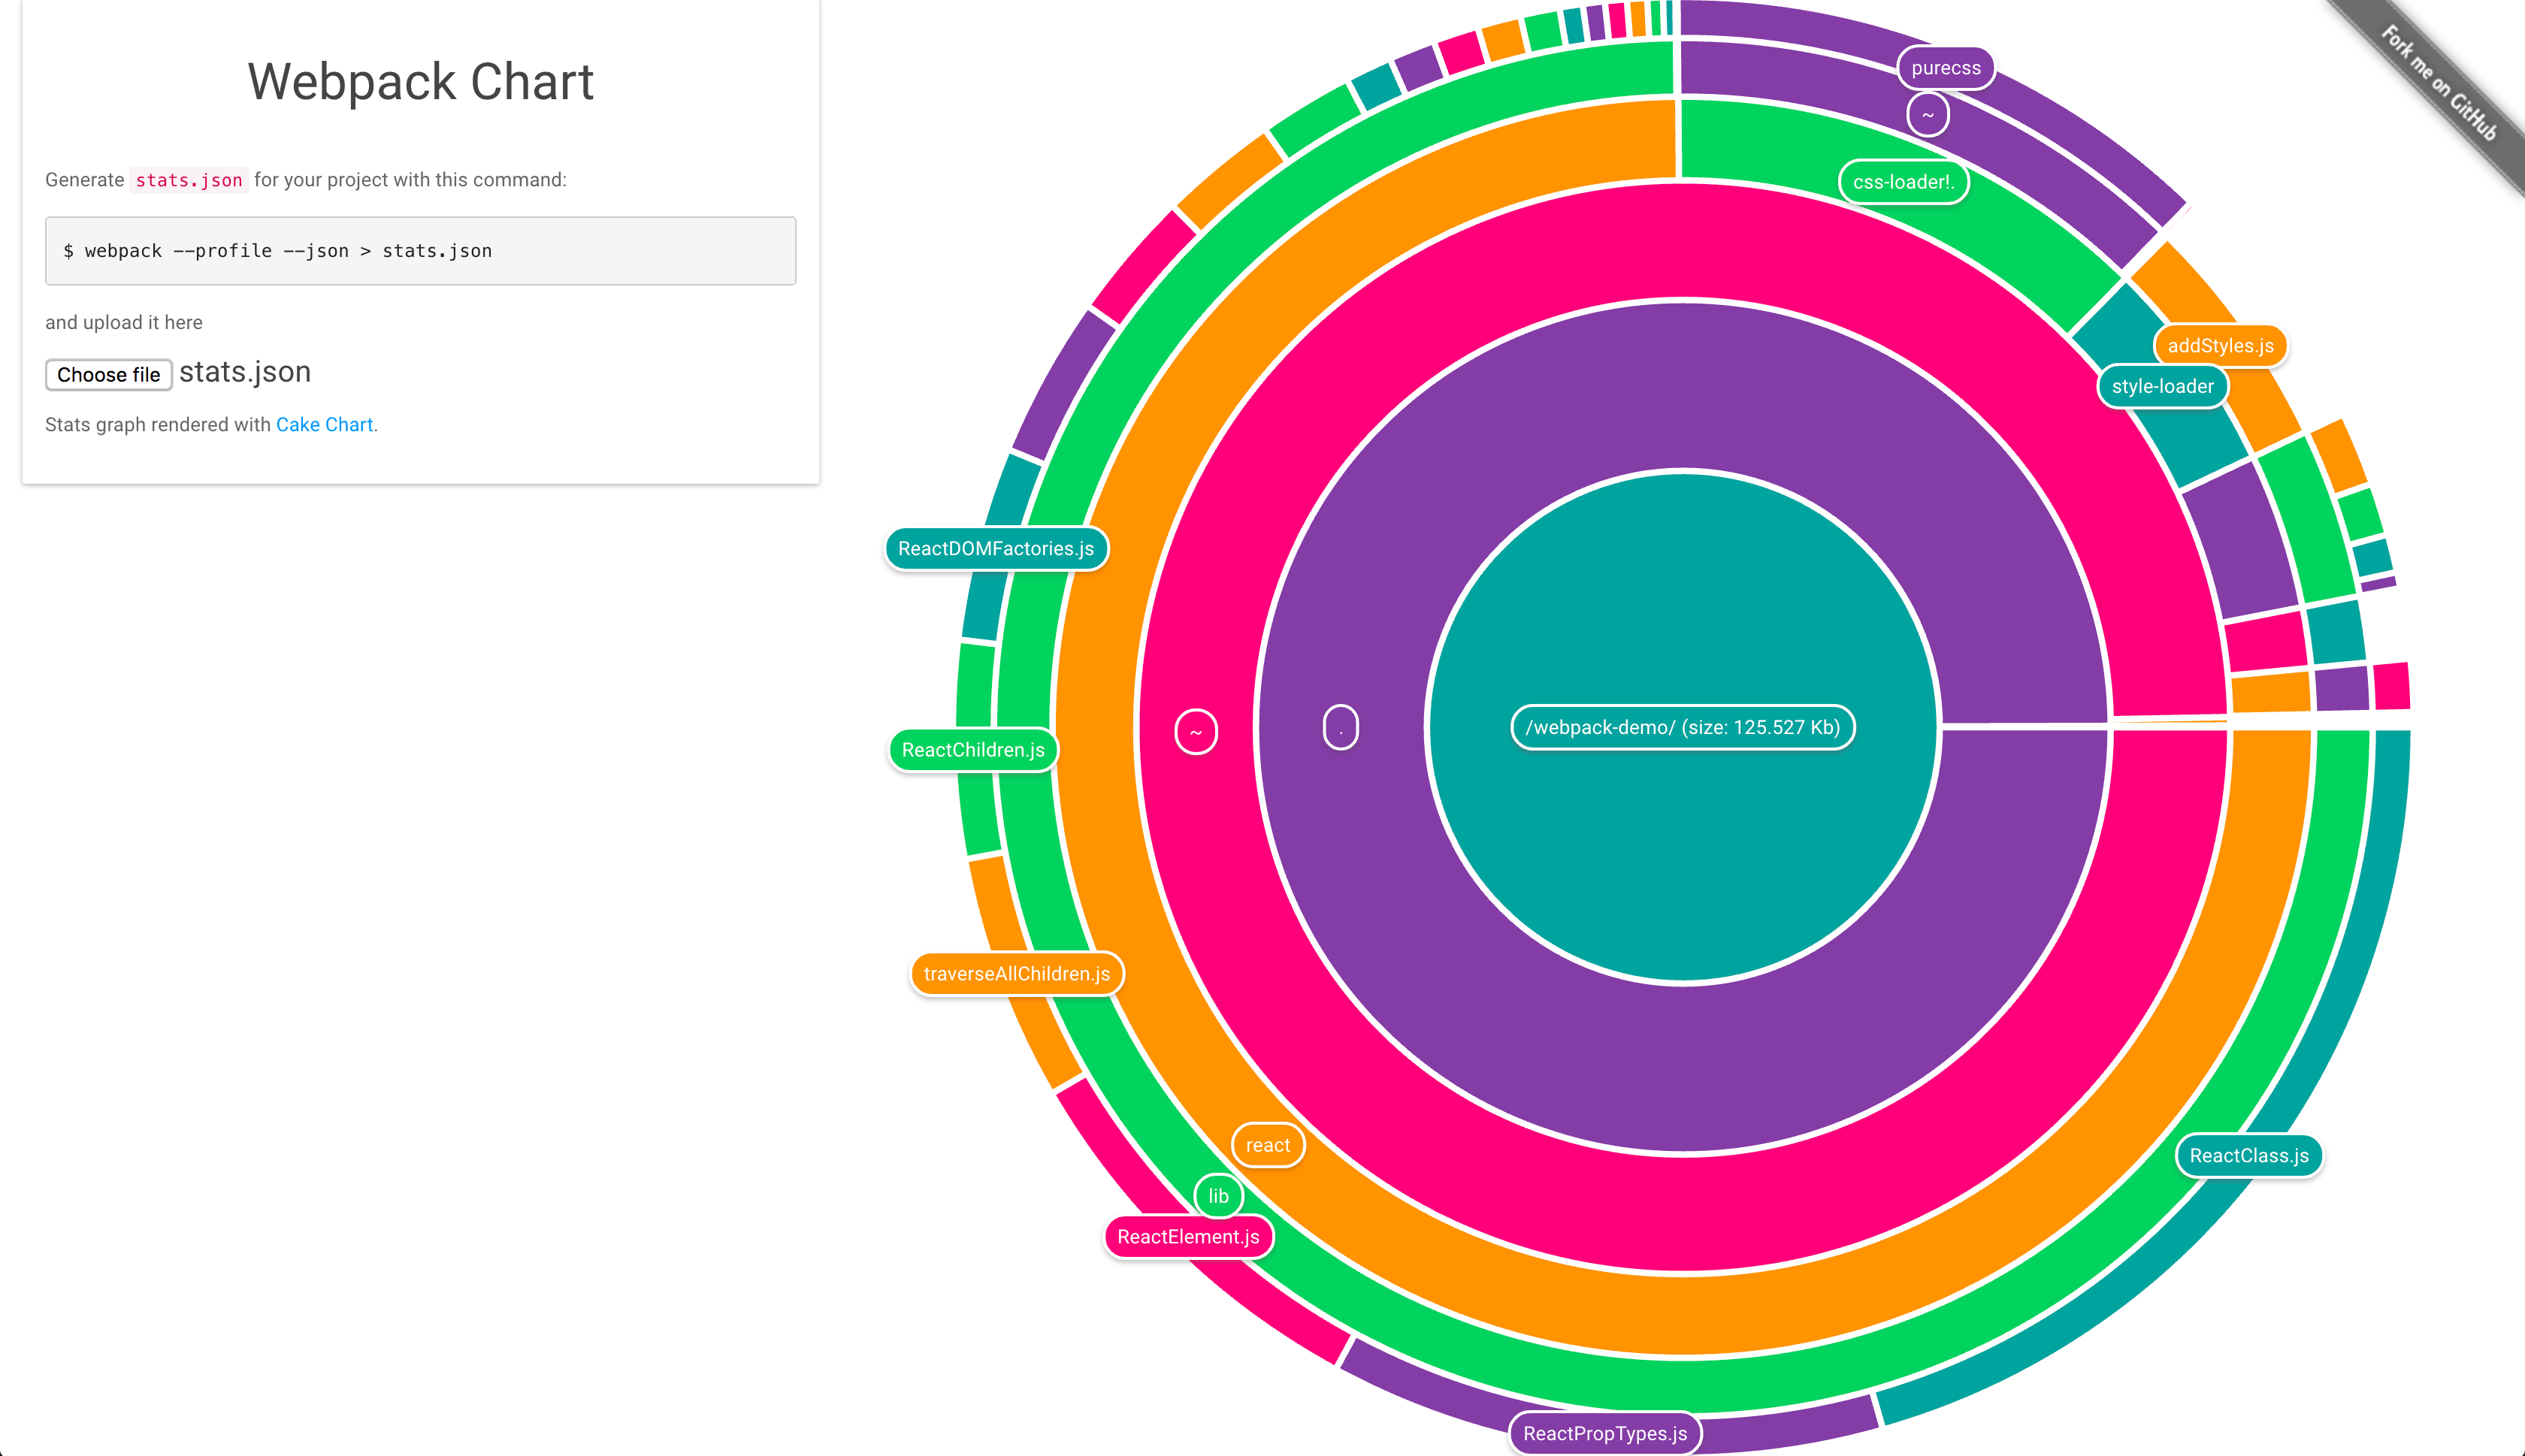
Webpack Chart is another similar visualization.
webpack-unused
webpack-unused prints out unused files and can be used to understand which assets are no longer used and can be removed from the project.
Stellar Webpack

Stellar Webpack gives a universe based visualization and allows you to examine your application in a 3D form.
webpack-bundle-tracker
webpack-bundle-tracker can capture data while webpack is compiling. It uses JSON for this purpose.
webpack-bundle-analyzer
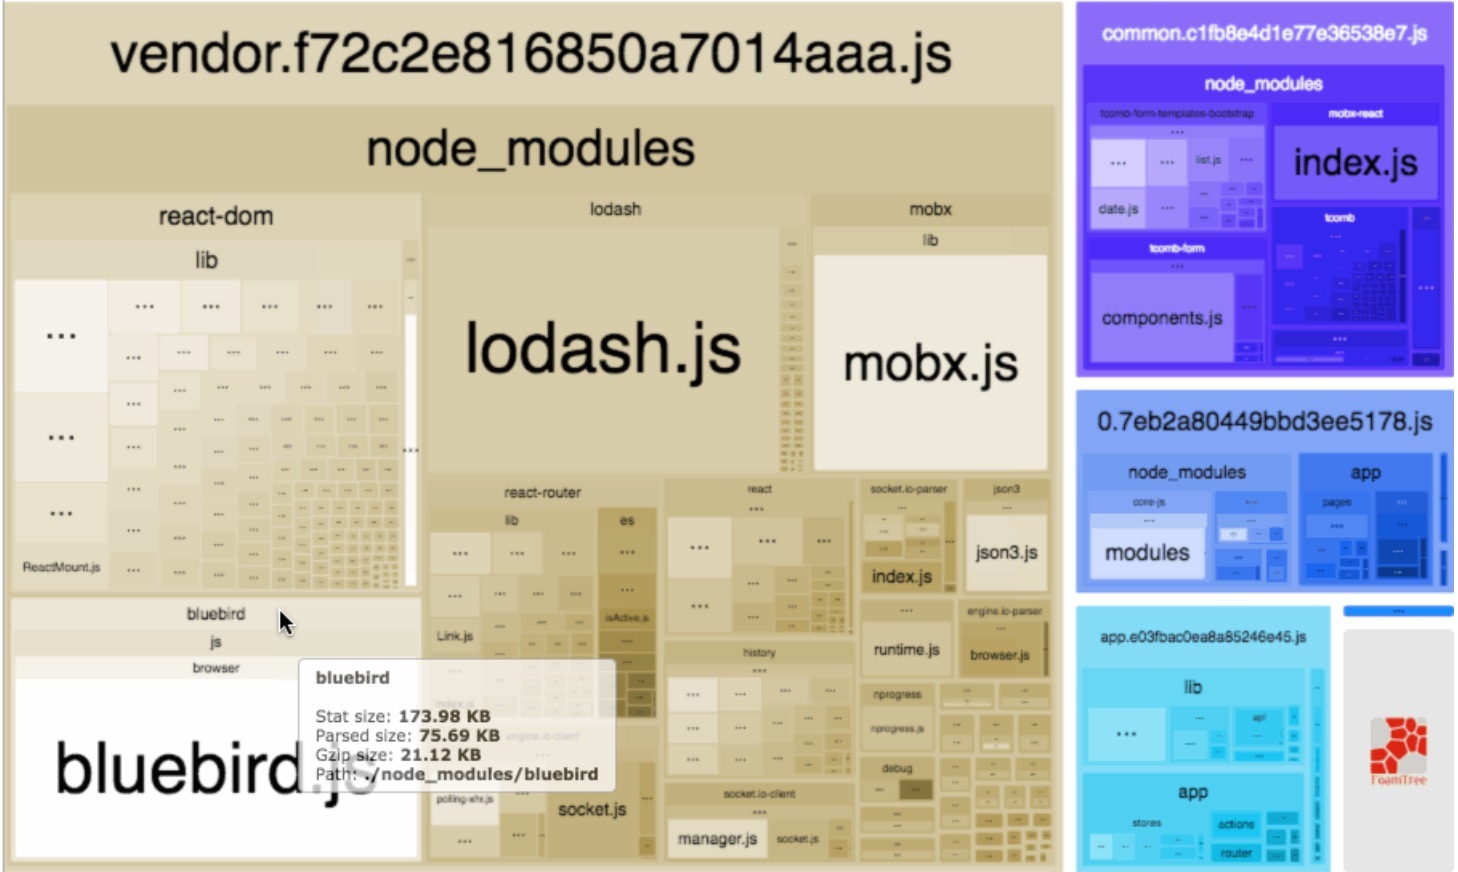
webpack-bundle-analyzer provides a zoomable treemap.
webpack-bundle-size-analyzer
webpack-bundle-size-analyzer gives a text based composition.
$ webpack-bundle-size-analyzer stats.json
react: 93.99 KB (74.9%)
purecss: 15.56 KB (12.4%)
style-loader: 6.99 KB (5.57%)
fbjs: 5.02 KB (4.00%)
object-assign: 1.95 KB (1.55%)
css-loader: 1.47 KB (1.17%)
<self>: 572 B (0.445%)
inspectpack
inspectpack can be used for figuring out specific places of code to improve. The example below performs duplication analysis:
$ inspectpack --action=duplicates --bundle=bundle.js
## Summary

* Bundle:
    * Path:                /PATH/TO/bundle.js
    * Bytes (min):         1678533
* Missed Duplicates:
    * Num Unique Files:    116
    * Num Extra Files:     131
    * Extra Bytes (min):   253955
    * Pct of Bundle Size:  15 %
Jarvis
Jarvis is a user interface that has been designed to show all information relevant to your webpack build. For example, it shows the amount of treeshakeable modules in the project and how well your assets perform against different connection types.
webpack-runtime-analyzer
webpack-runtime-analyzer gives real-time analysis over webpack bundles. You can see bundle composition in multiple formats through the user interface, bundle sizes, and module details. It combines features of many tools above into a single one.
Webpack Monitor
Webpack Monitor is another similar tool with an emphasis on a clear user interface. It's able to provide recommendations on what to improve the build.
webpack-deps-tree
webpack-deps-tree displays webpack module graph. Using it you can understand how modules of your bundles are related to each other.
Duplication Analysis
In addition to inspectpack, there are other tools for figuring out duplicates:
- bundle-duplicates-plugin operates on a function level.
- find-duplicate-dependencies achieves the same on an npm package level.
- depcheck goes further and warns if there are redundant dependencies or dependencies missing from the project.
- bundle-buddy can find duplicates across bundles while providing a user interface to tune webpack code splitting behavior. bundle-buddy-webpack-plugin makes it simpler to use.
Independent Tools
In addition to tools that work with webpack output, there are a couple that are webpack agnostic and worth a mention.
source-map-explorer
source-map-explorer is a tool independent of webpack. It allows you to get insight into your build by using source maps. It gives a treemap based visualization showing what code contributes to the result.
madge
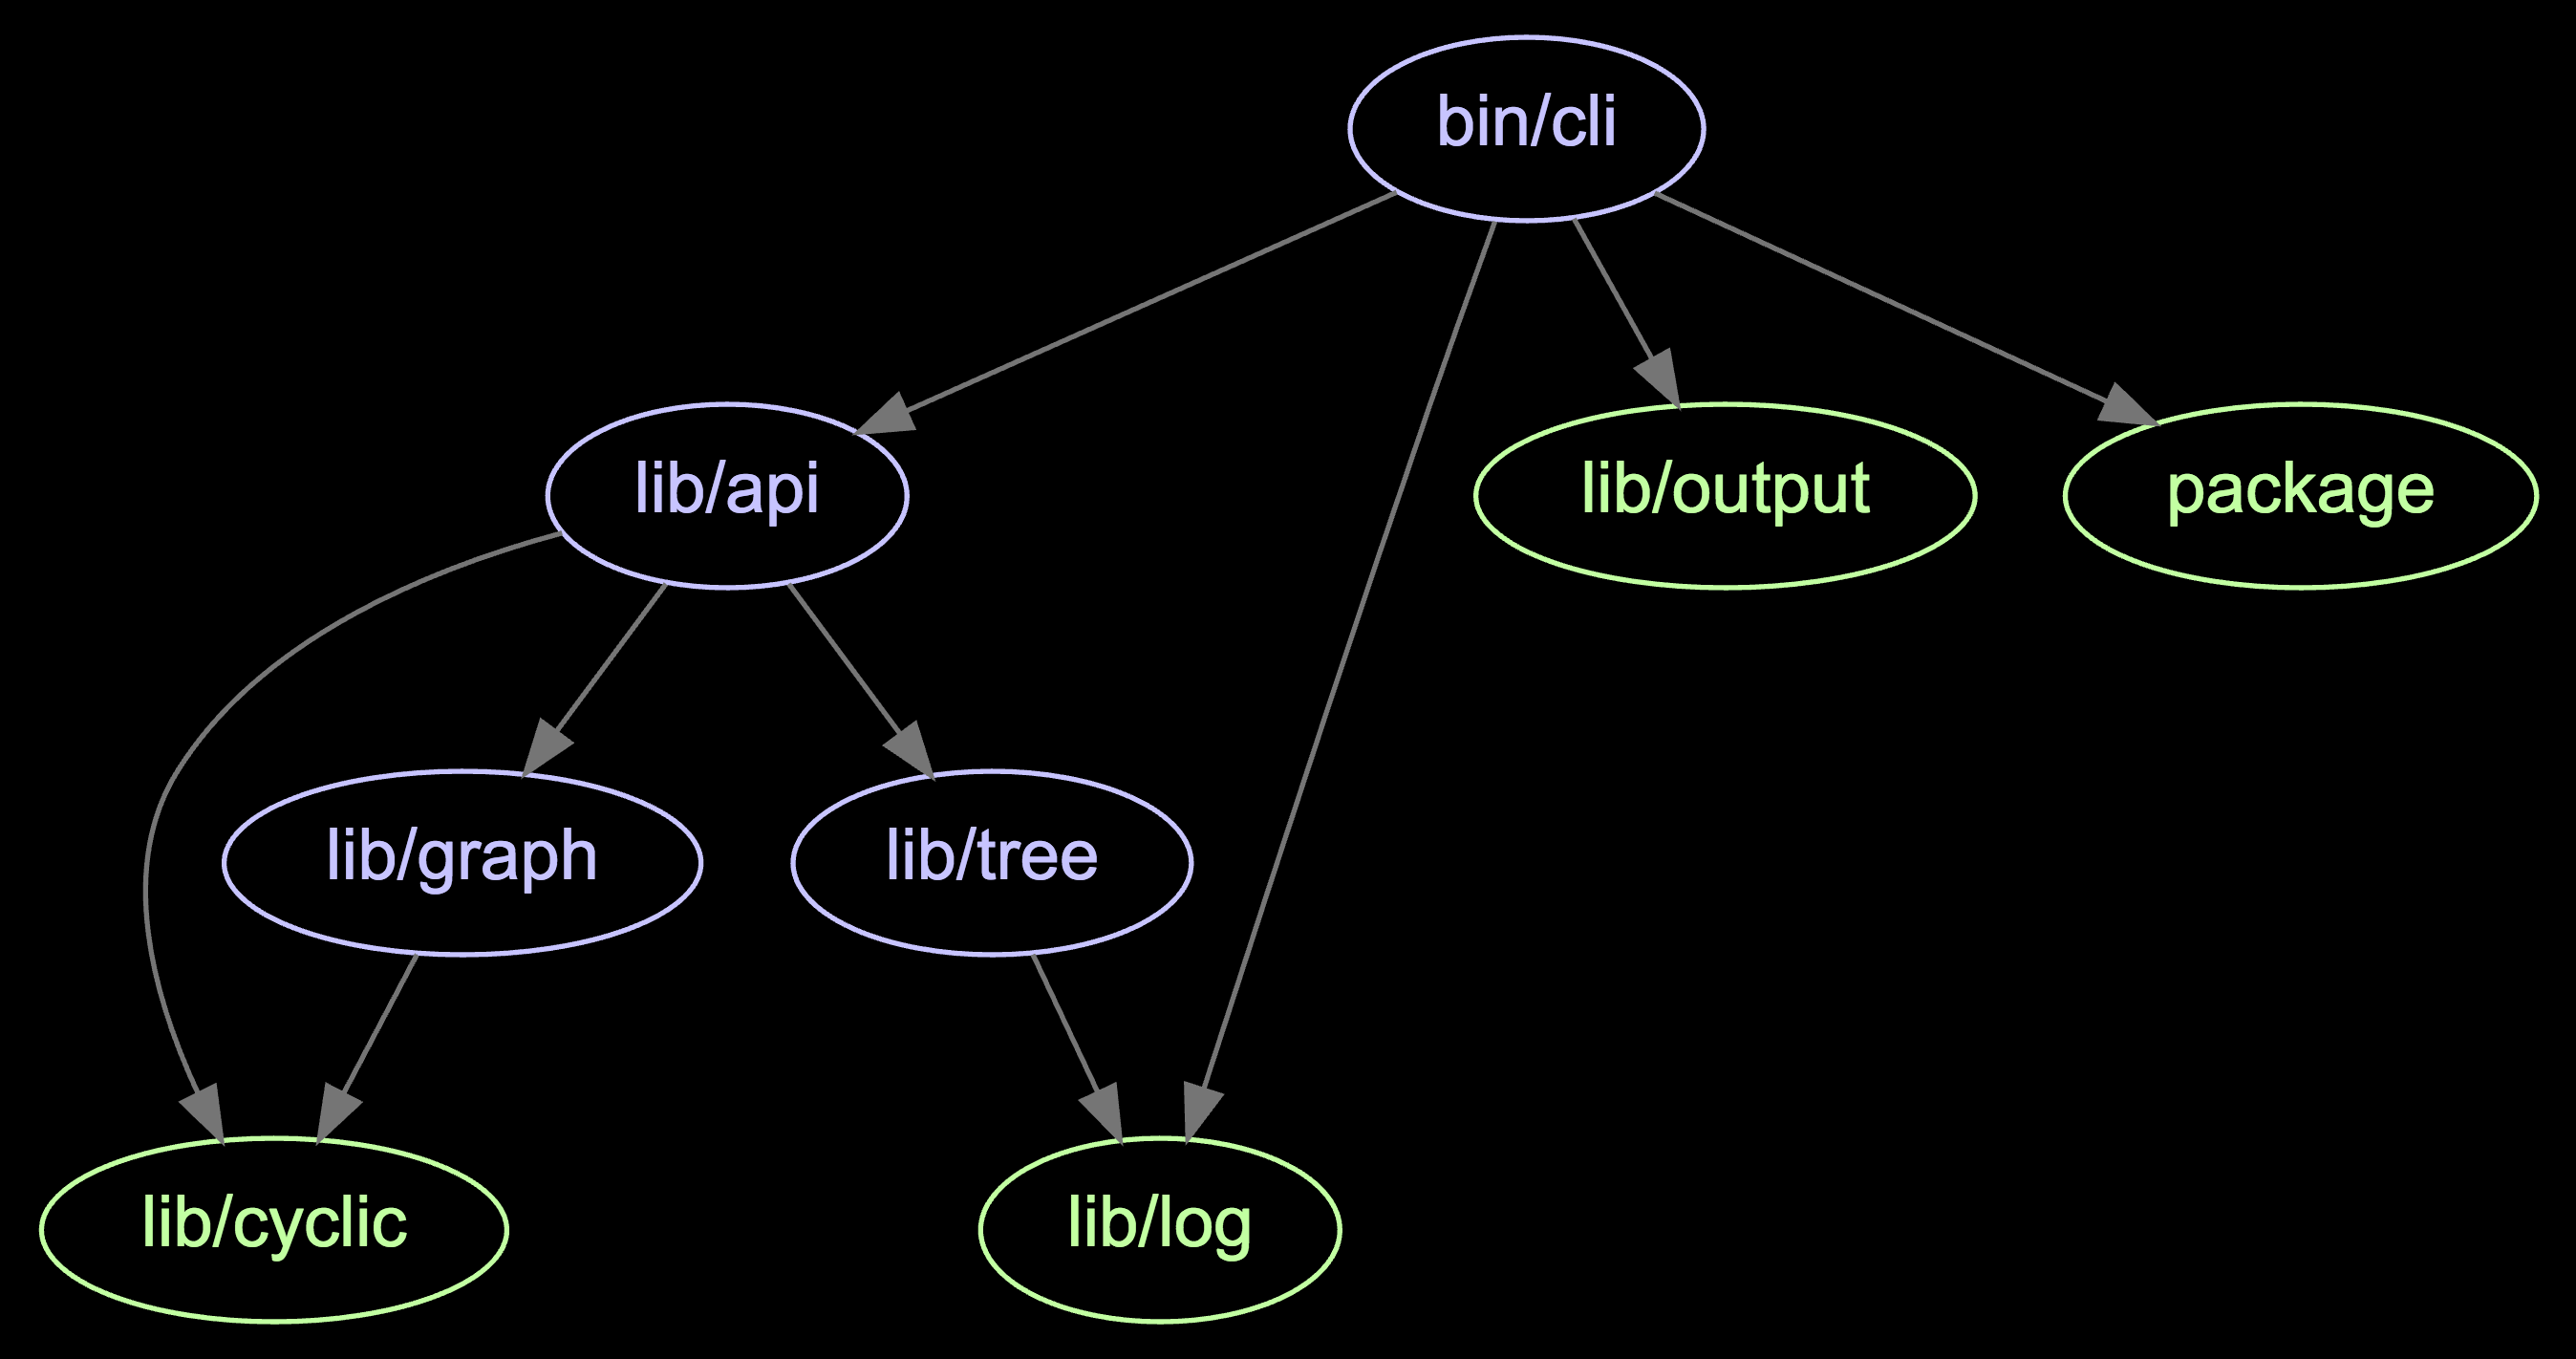
madge is another independent tool that can output a graph based on module input. The graph output allows you to understand the dependencies of your project in greater detail.
Conclusion
When you are optimizing the size of your bundle output, these tools are invaluable. The official tool has the most functionality, but even a rudimentary visualization can reveal problem spots. You can use the same technique with old projects to understand their composition.
To recap:
- Webpack allows you to extract a JSON file containing information about the build. The data can include the build composition and timing.
- The generated data can be analyzed using various tools that give insight into aspects such as the bundle composition.
- Performance budget allows you to set limits to the build size. Maintaining a budget can keep developers more conscious of the size of the generated bundles.
- Understanding the bundles is the key to insights on how to optimize the overall size, what to load and when. It can also reveal more significant issues, such as redundant data.
- You can find third-party tools that don't depend on webpack but are still valuable for analysis.
You'll learn to tune webpack performance in the next chapter.